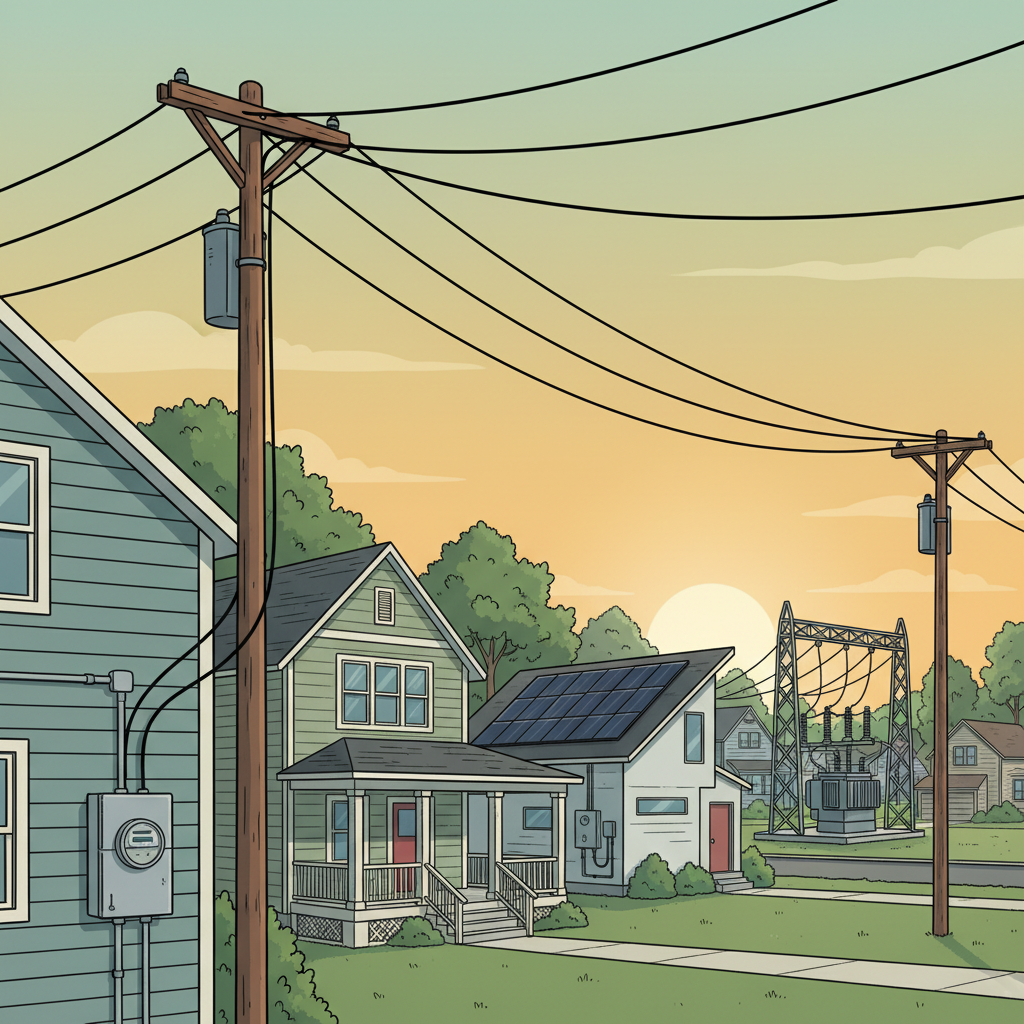
US electricity is easy to ignore until the bill arrives or the power goes out. The system behind that switch includes about 1.19 billion kilowatts of installed capacity in the United States, and it works only because the grid keeps supply and demand in balance at all times. That raises a practical question: how does electricity get to your home, and what numbers should you check when you compare utility power, local generation, cost, and safety?
Grid balance shapes every bill
The US electric grid is a network of transmission lines, substations, and distribution systems that must constantly balance supply and demand. Electricity supports daily life, economic activity, and public safety by moving power to homes, businesses, and infrastructure.
That constant balance matters because power has to be delivered through connected equipment, not treated like a product you simply store on a shelf at the point of use. Transmission lines move electricity over distance, substations adjust and route it, and distribution systems carry it to end users. When demand changes, the grid has to respond through that network so homes and businesses keep receiving power.
The Department of Energy has overseen national energy policy and production since 1977. Interstate transmission is regulated by the Federal Energy Regulatory Commission, which covers electricity along with natural gas and oil. For you, that means the system is both physical and regulated: wires deliver the power, and federal oversight shapes how major interstate movement is managed.
Where your power can come from
The supply side is not a single fuel source. Nuclear power plants generated nearly 782 billion kilowatt-hours of electricity in 2024, and nuclear power has provided about 20% of US electricity since the 1990s. In 2023, US nuclear plants operated at full capacity more than 92% of the time.
Those numbers matter because a grid that must stay balanced depends on sources that produce large amounts of electricity on a sustained basis. Nuclear generation also avoids more than 430 million metric tons of CO2 emissions annually in the United States, so the mix of power sources affects both supply and environmental impact.
Renewable electricity has also grown. Electricity generated from renewable sources in the United States increased by about 85% from 1980 to 2011. That growth changes how many homes think about electricity, because some generation can now happen closer to where you use it instead of only at large centralized plants.
Local generation changes the flow
Distributed generation refers to technologies that generate electricity at or near where it will be used, including solar panels and combined heat and power. The practical difference is location. Instead of electricity traveling only from large power plants through the full grid path, some power is produced near the building that uses it.
That changes the decision you face at home because the comparison is no longer only utility service versus no service. In 42 of the 50 largest US cities, going solar is less expensive than relying solely on utility-generated electricity.
The environmental side also gets more complicated once power is produced in different places. The Environmental Protection Agency tracks the environmental impacts of both centralized and distributed electricity generation. That matters because the source of power affects more than price alone.
Environmental trade-offs are not one-note
Cleaner electricity is not a single switch. Nuclear power avoids more than 430 million metric tons of CO2 emissions annually in the United States, which makes it a major low-carbon part of the grid.
At the same time, some grid equipment has its own environmental concerns. Sulfur hexafluoride, used as insulation in high-voltage circuit breakers and switches, is a potent greenhouse gas that can leak from aging equipment. The trade-off is straightforward: the grid needs specialized equipment to move and control electricity, yet some of that equipment can create environmental risk through leakage.
Cost data and rules differ
The simplest rule is to compare your utility bill with local generation options, but that rule fails if you skip the public numbers and standards behind the system. Household electricity costs are published by the US Census Bureau in table B25132, and the US Energy Information Administration provides open data and interactive tools for electricity statistics and analysis.
Those two sources serve different jobs. Census table B25132 helps you compare monthly household electricity costs. EIA tools help you check the broader electricity picture through official data and analysis. If you want to know whether your bill looks typical or whether a local power option might change your costs, you need both the household cost view and the system-wide data view.
Standards also change by setting. ANSI C12.1-2026 is the American National Standard for electricity metering in the United States. That matters when meter accuracy and electricity measurement are part of the issue, because the meter is the point where electricity use becomes a billable number.
Workplace safety follows a different rule set. OSHA’s Electrical Standard, 29 CFR 1910 Subpart S, sets requirements for electrical safety in US workplaces. A home decision about cost or local generation is not the same as a workplace safety obligation, so the right standard depends on where the electricity is being used and what issue you are trying to solve.
Choose the numbers to check
If your main problem is a rising bill, start with a cost comparison. Pull your monthly electricity charges, then compare them with the household electricity cost data in Census table B25132. After that, use EIA electricity data tools to place your bill in the larger context of US electricity supply and statistics.
If your main problem is choosing between utility supply and local generation, use the location rule first. Distributed generation includes technologies such as solar panels that generate electricity at or near where it will be used, and in 42 of the 50 largest US cities, going solar is less expensive than relying only on utility-generated electricity. That does not mean solar is the right answer in every case, but it does mean a utility-only assumption can miss a lower-cost option in many large cities.
| Option | What to check | Why it matters |
|---|---|---|
| Utility power only | Monthly household electricity cost in Census table B25132 | Gives you a published benchmark for household electricity costs |
| Distributed generation | Whether your option generates electricity at or near where it will be used | Local generation changes the path electricity takes to your home or building |
| Solar in a large city | Whether your city falls within the 50 largest US cities | Solar is less expensive than utility-only electricity in 42 of those 50 cities |
| Metering issue | ANSI C12.1-2026 | Metering standards control how electricity use is measured |
| Workplace issue | OSHA 29 CFR 1910 Subpart S | Electrical safety requirements change when the setting is a workplace |
Residential and workplace checks
Use this checklist before you act on an electricity problem:
- Check household cost data in Census table B25132 if the issue is your monthly bill.
- Check EIA electricity data tools if you need official US electricity statistics or trend data.
- Check ANSI C12.1-2026 if the issue involves electricity metering.
- Check OSHA 29 CFR 1910 Subpart S if the issue involves electrical safety in a workplace.
- Check whether a local option counts as distributed generation if power would be produced at or near where you use it.
If you started with a bill or outage in mind, keep the next step narrow. Compare your monthly cost with Census table B25132, decide whether your home fits a utility-only or distributed-generation path, and match any meter or safety issue to the right standard before you spend money or file a complaint.
Quick reference table
| Key Point | Detail |
|---|---|
| US installed capacity | About 1.19 billion kilowatts at the end of 2023 |
| Nuclear share | About 20% of US electricity since the 1990s |
| Nuclear output | Nearly 782 billion kilowatt-hours in 2024 |
| Solar city comparison | Less expensive than utility-only power in 42 of the 50 largest US cities |
| Best bill-check source | Census Bureau table B25132 for monthly household electricity costs |
Leave a Reply